

Q2 2026
COGNITIVE DISSIDENCE
Headlines were conflicting and chaotic throughout the quarter. Sentiment remained low and fear elevated. Yet, markets had spectacular returns with a straight-line trajectory. It was a quarter of holding conflicting beliefs all at once. We live in “troubling times” all while consensus was to be bullish. We believe there were a couple material changes in the quarter and one important constant.
- Warsh FOMC – This could be a VERY different Fed than the last 20-years.
- Financing Growth – Corporates in focus as they are stepping on the gas.
- Tech vs The Rest – Returns were highly concentrated leaving volatility stretched.
These major market themes are causing the market and economy to become more interconnected. Financed growth can cause all assets to act like a light switch. We very much saw this during the quarter as the switch was “off” during March with geopolitical conflict and quickly flipped to “on” in Q2.
Please join us in this quarterly update to learn what we saw as major changes during a quarter which provided specular returns to risk assets, what increased inter connectivity of markets/economy means for your portfolio, and Convexitas firm updates.
Market commentary
Warsh – New FOMC and what does it mean for markets?
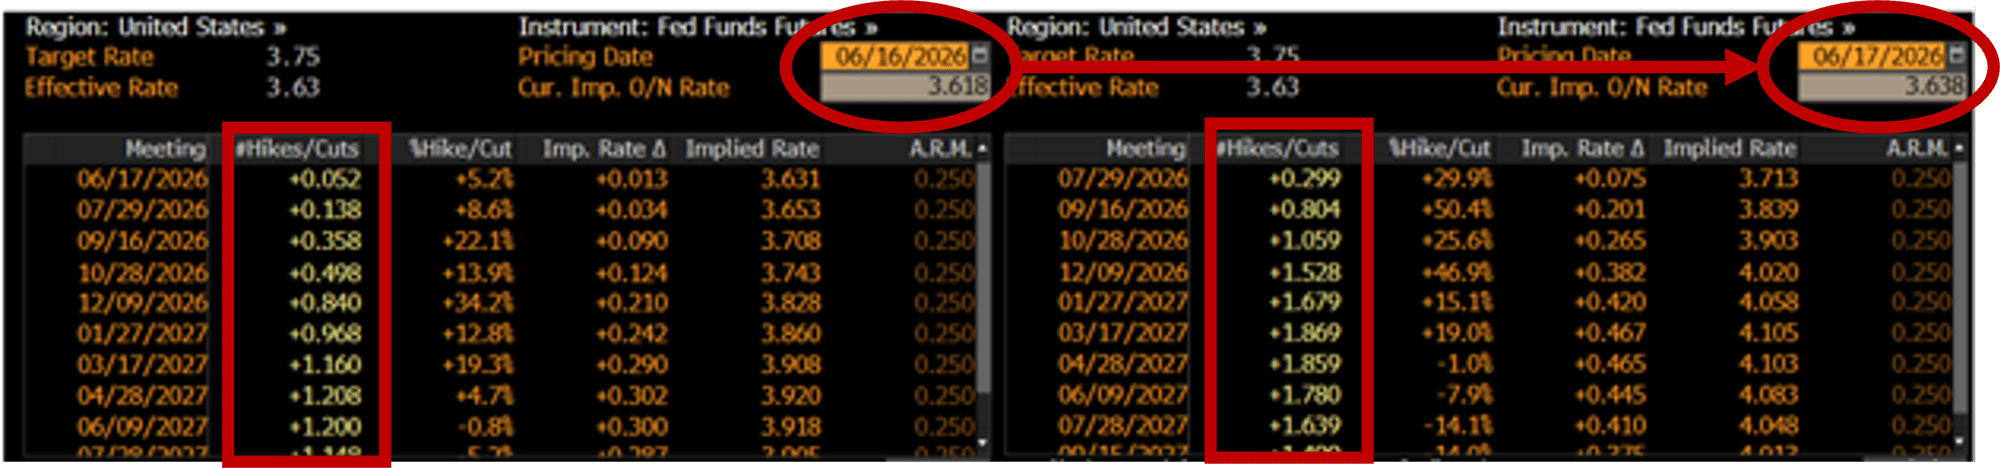
One meeting does not tell you 4 years of actions, but Warsh absolutely set a new tone for the Federal Reserve. He emphasized the need for price stability, suggesting he is more concerned with the inflation side of the Fed’s dual mandate over employment. He believes in strong medicine, prescribed in a timely manner, allows the patient to recover more quickly. He started the press conference with “persistently high prices are a burden for the American people” and “this committee will deliver price stability”. His hawkish tone was a shock in comparison to market expectations. Most believed he would try and set the table for the ability to cut rates against a political backdrop clearly seeking cuts. Instead, it was a significant change from the Powell-era willingness to look through persistently above-target core inflation. Fed Fund Futures reacted by adding ~1 hike to the second half of 2026.
Source: Bloomberg
More importantly in our view, the Fed is going to look significantly different. The new goal of the Fed is to be less involved in the day-to-day lives of market participants. This is a large contrast to the previous 20 years when bond traders were “handed the script” well before any actions. Warsh outlined that markets should expect much less forward guidance. He himself did NOT contribute a dot in the Summary of Economic Projections (SEP). Additionally, he said he believes that many of the survey-based measures used to assess the health of the economy are unsatisfactory. The most interesting statement, in my opinion, made by Warsh was that market prices contain high value information for the central bank. If the Fed itself pollutes this information with forward guidance, then the Fed is removing a very important input from its toolkit. What all this likely means is the Fed will move more quickly to changes in the economy, will be significantly less predictable meeting-to-meeting, but potentially much more credible to markets at achieving the mandate.
Source: Bloomberg
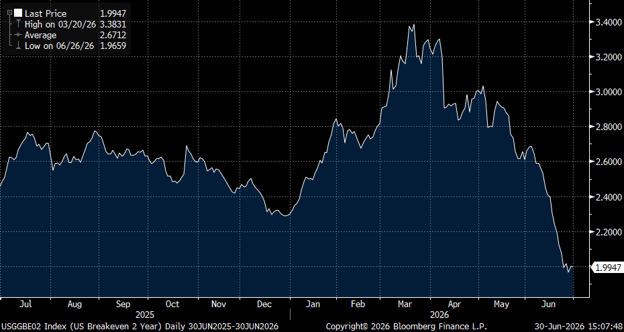
Inflation expectations when looking at breakevens in the TIPS market have been declining along with oil prices but the decline accelerated post Warsh’s first FOMC meeting. In fact, 2-year breakevens are trading exactly at the FOMC’s target of 2%. Goal accomplished? I believe Warsh and Bessent are working together to accomplish one major goal: stabilize long-end interest rates. A Fed willing to fight inflation, or at least a strong tone saying they are willing to fight inflation, should be helpful for the long end. Fiscal spending can more easily remain at the current substantial levels if long-end rates (the part of the curve much harder to control through policy actions) remain contained. A more proactive central bank can increase the institution’s credibility, which ultimately means it increases the ability to convince markets of the ability to act before a problem becomes embedded.
Now that every meeting is “live”, what does this mean for markets? For rates, this should mean a flatter curve. The front-end is likely to have more volatility which should mean higher yields to compensate investors for that additional risk. The long-end on the other hand, should have lower yields. A Fed that adjusts policy more aggressively should be able to reduce the probability of inflation persistence. With the reduction of this “left tail” the volatility surface should flatten and compress term premium as a result. For equities, we should expect more market moves on announcement days as FOMC meetings will be much less predictable. That said, lower predictability will be balanced against equities long duration nature and if the Fed is successful at reducing term premium, that should result in higher valuations from lower long-end risk free rates.
Financing Growth – Governments / Corporates / Consumers
Global government spending continues to be a larger than historically normal contributor to global GDP. This spending must be financed as developed world governments are running elevated deficits for a non-crisis period. Additionally, the US government has shortened average maturity of outstanding debt resulting in ~10 trillion in need of refinancing for 2026. Approximately 1 out of every 5 dollars in tax collections is used for debt service and this will only continue to grow. The ability to finance growing deficits is extremely important for the global growth outlook.
Source: Bloomberg
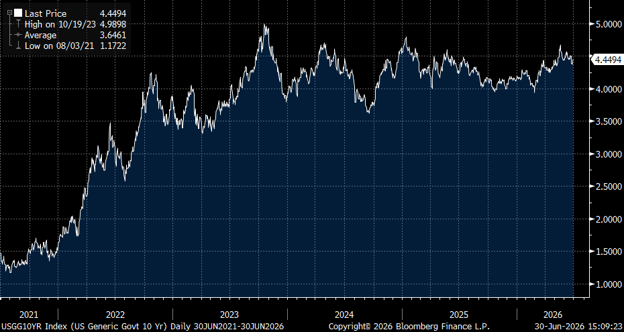
The Iranian conflict increased the cost of borrowing as inflation expectations increased. With that said, the move in rates was contained. 10-Year Treasury yields have been in a tight range ever since mid-2022 even as the fiscal situation for the US government continues to deteriorate. Scott Bessent has made containing the long end a priority and now Warsh seems to be working with the Treasury with the same goal in mind. If global governments plan on facilitating growth in an ever-accelerating fashion, it is imperative that long-end interest rates remain contained. For now, long-end rates have behaved, and governments have maintained the ability to continue to finance growth. The main financing risks have recently shifted to the corporate space.
Corporations have been aggressively coming to market for capital in 2026. AI infrastructure buildout is the main source of demand. Datacenter buildout is the major R&D expense in the US. The One Big Beautiful Bill allows for accelerated depreciation for these R&D expenses. Outside of hyperscalers investing for growth, there is an increased incentive to build NOW.
Some headlines of the quarter on this topic:
“Google Upsizes Equity Offering To Fund AI To $84.75 Billion”
“Alphabet Inc., Google’s parent company, has issued a rare 100-year bond as part of a roughly $32 billion multi-currency debt offering.”
*https://gfmag.com/capital-raising-corporate-finance/alphabet-taps-debt-markets-with-100-year-issuance/
“Meta raises $25billion in bond sale after lifting AI spending forecast”
*https://www.reuters.com/business/meta-looks-raise-up-25-billion-with-bond-sale-bloomberg-news-reports-2026-04-30/
“Amazon Raises $54B in Record Bond Sales as Investors Place $126B Orders”
*https://finance.yahoo.com/news/amazon-raises-54b-record-bond-144705950.html
“SpaceX launches $25 billion notes offering for debt repayment, AI expansion”
*https://www.reuters.com/legal/transactional/spacex-launches-25-billion-notes-offering-source-says-2026-06-23/
“SpaceX IPO haul rises to $85.7 billion after underwriters exercise greenshoe”
* https://www.reuters.com/business/media-telecom/spacex-ipo-raises-857-billion-underwriters-exercise-greenshoe-option-2026-06-15/
Investment Grade (IG) issuance has been subdued ever since the 2021 refinancing cycle. This is no longer the case. The largest US corporations can no longer finance the AI buildout from free cash flow (FCF), so these entities are turning to the debt and equity markets. The onslaught of issuance has amazingly been met with insatiable demand. With the accelerated growth of annuity products due to wealth demographics, the demand for spread products remains high. Investment grade spreads are near YTD tights and new issuance has been well oversubscribed.
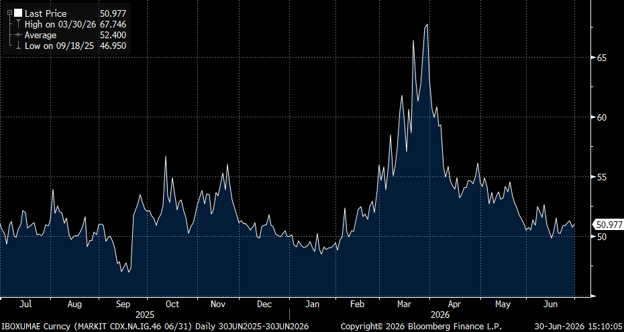
Source: Bloomberg
Even the “riskiest” issuer at the center of datacenter buildout, ORCL, has performed well in the face of all this issuance. Oracle reported earnings on June 10th and forecasted capital spending plans well above expectations. They plan on issuing ~40B of debt and equity to facilitate the continued build out. Oracle 5-year CDS tightened ~3bps on the week and has been very rangebound all year. Credit markets remain wide open to hyperscalers, which means the astronomical CapEx expenditures are likely to continue. This should be good news for our Concentrated Correlation Harvester (CES) strategy, but more on that later.
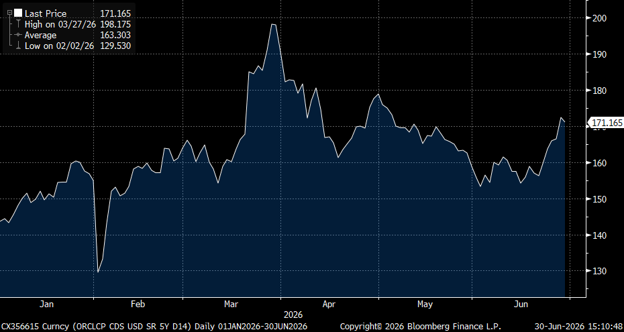
*Source: Bloomberg
Private credit remains the one area of stress for fixed income markets. Throughout the whole quarter, markets had to digest negative headlines of semi-liquid private credit funds gating withdrawals. Investors are becoming increasingly nervous about the space and are trying to vote with their feet. Managers continue to push the narrative that default and recovery rates for private credit investments are in-line with historical norms; however, secondary market levels suggest investors believe more losses lie ahead. Private credit is heavily allocated to the software sector, where revenue stability has come into question due to advancements in AI. While defaults remain reasonable for now, this substantial asset class represents the primary source of stress for public credit markets.
*Source: Citadel Securities
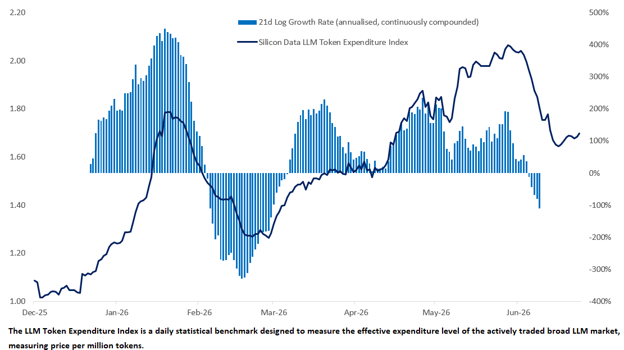
Fixed income is an extremely important indicator for markets and the economy. In 2026, credit markets became the main source of growth for the most dominate sector of the economy, technology. Hyperscalers need financing to facilitate the buildout of AI as CapEx is surpassing Free-Cash-Flow (FCF) of these businesses. The investment hurdle rate for these companies is double digit IRRs, issuing 30-year paper in the 6-7% area would appear to be an attractive decision: “borrow at 7% to make 20%”. This is a logical decision as long as the confidence in the “20%” remains high. Token expenditures have exploded higher in Q2 2026. For the moment, investment in the buildout is likely to continue. Hyperscalers are A to AAA rated, so they remain solidly Investment Grade borrowers. MSFT 5Y CDS is even tighter than the US Government! My point is these companies are utilizing debt markets to finance continued growth. If the market is willing to lend, the debt-financed CapEx cycle is likely to continue. For now, Credit markets remain wide open, but that needs to remain the case for growth, especially in the most important sector for the US and many Asian economies.
Consumers are supporting consumption through investment in risk assets. This means asset price appreciation rather than wages is more important for growth than at any other time in history of the US. This is both from demographics and lower income individuals becoming investors in 2020. The retail investor has become the market’s strong source of demand and when looking at retail volumes in cash and options, activity is persistent and increasing.
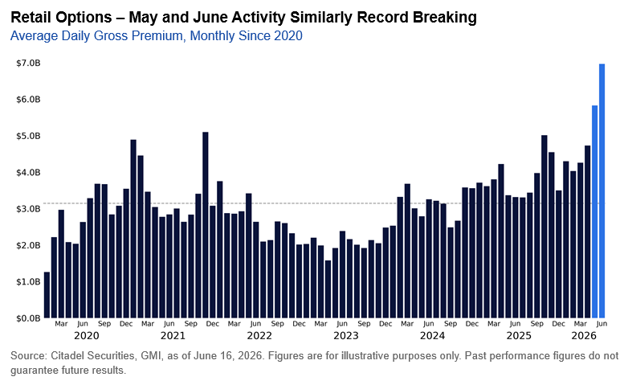
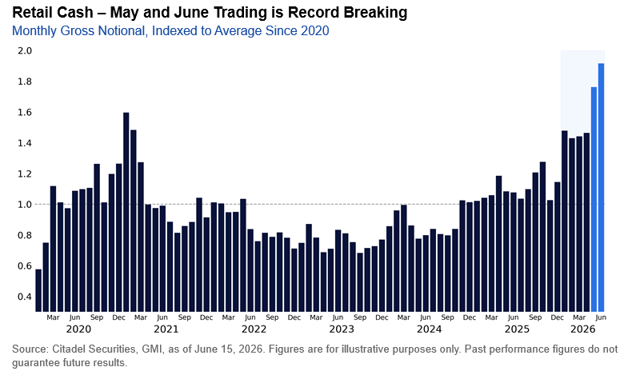
It is not only the ultra-wealthy supporting consumption from asset price appreciation. Consumption accounts for nearly 70% of US GDP, so this creates a very recursive situation. If asset prices appreciate, consumption increases, earnings increase, which all supports further asset price appreciation. The reverse could also be true. After a specular quarter of returns for risk assets, you can see the circular nature of the current system with the record-breaking trading activity in stocks and options. The consumer remains employed and invested, so supporting expenditures from investment has continued to drive consumption higher.
Tech vs The Rest – Technology dominance but what’s with volatility?
US Market returns for Q2 were heavily concentrated in technology. AI infrastructure buildout has not only been the focus of corporate issuance but also where equity investors have been rewarded. Risk assets as a whole had a spectacular quarter with the S&P500 closing Q2 up +15.2%. With markets closing near all-time highs and geopolitical risk declining, SPX 1-month implied volatility is oddly still sitting at 60th percentile over the last 5-years. Volatility markets are elevated where most of the gains have been earned in 2026.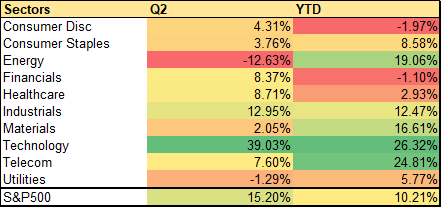
* Bloomberg & Convexitas Calculations
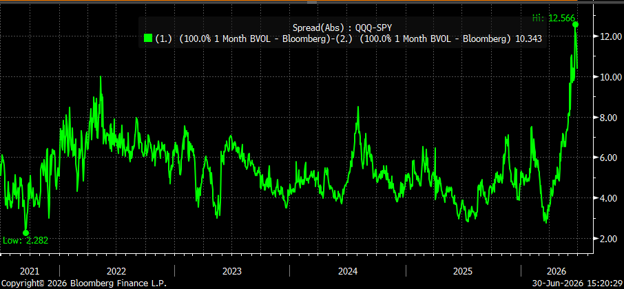
The overlap between SPY and QQQ is extremely high. Realized correlation is ~0.93 over the last year and a raw beta of ~1.3. This makes sense as 9 of the top 10 holdings in each are the same tickers. Since the composition is so similar and the correlation is so high, one might expect the implied volatility of the two ETFs to be similar. 1-month At-The-Money volatility has indeed been tight between the two. That is until this quarter.
*Source: Bloomberg
QQQ volatility has been increasing in comparison to SPY volatility for almost the entirety of Q2. All while technology was the driving force of returns for the S&P500. Volatility on the "winners" is expanding while volatility on the "losers" is not. The “Stocks Up + Vol Up” dynamic has been a common theme during the quarter and can even been seen in the broader indices. QQQ 1-month at-the-money implied volatility is ending the quarter at ~73rd percentile over the last 5-years. Additionally, when looking at open interest (option positions which remain open) it is heavily tilted towards the put side. With a combination of elevated implied volatility and open interest tilting towards puts, it suggests hedging activity.
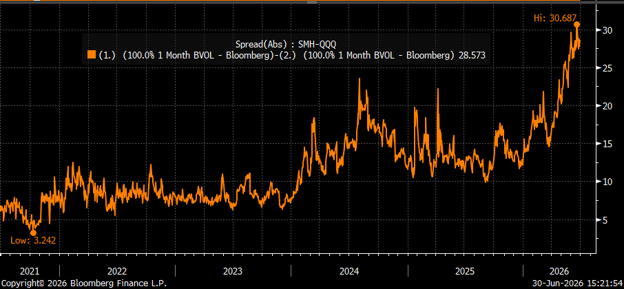
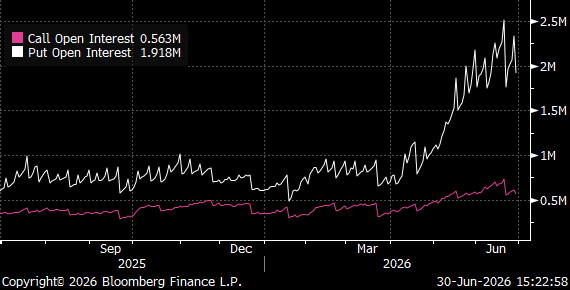
If QQQ volatility is elevated, then SMH volatility is very elevated. SMH 1-month at-the-money implied volatility is at ~99th percentile over the last 5-years. Semis have been the dominate sector thus far in 2026 and the implied volatility of the sector is incredibly stretched. When considering the positive experience of being invested in the sector, this is historically odd behavior for volatility. Volatility is supposed to be at highs during a panic selloff, not a rally!
*Source: Bloomberg
Put/call volumes in SMH are dramatically tilted towards puts. Put open interest is ~3x that of call open interest. Both volumes remain high but put volumes have been constantly ~4x that of calls throughout the quarter. Again, the absolute level of implied volatility is extremely elevated and increased throughout Q2. This suggests that most investors have been “fighting” the rally instead of “leaning” into it. With the sectors that have had the best performance suggesting heavy hedging activity, the rally may be more stable than one might normally expect. If investors were chasing the “winners” by buying expensive calls in those names (think 2021) than euphoria / mania would create potential issues for these assets. This has NOT been the case. In fact, it has been the opposite. The momentum factor exists because human psychology likes to trim winners and buy losers, even when fundamentals are causing certain names to win or lose. When looking at the very likely hedging activity throughout technology and especially semiconductors, we believe we see the normal human psychology of trimming winners playing out.
*Source: Bloomberg
Major market themes are becoming more interconnected. We have been discussing for a while the need for financing across all three major economic growth segments and how the need to borrow to support spending can cause all assets to act like a light switch. On/off are the only modes. During the quarter, the “On” was extreme AND concentrated to where the borrowing was focused. Hyperscalers tapped the debt and equity markets to support datacenter CapEx. Sure enough, the companies who received those checks from hyperscalers were the best performers. Ability to finance even with geopolitical risk remained easy and the borrowed capital flowed to companies in charge of building the infrastructure for growth.
Many market participants believed that the new Fed Chair was going to be focused on keeping the easy money flowing. This may indeed turn out to be true BUT in a different form than expected. One meeting in, the focus was entirely pointed to stable prices. An additional hike was priced into Fed Fund Futures, but the curve flattened. Outside of the US government, most financed growth comes from term, not spot borrowing. Said more simply, 10s matter more than 2s. Warsh may have talked a strongly hawkish game, but the goal may be to lower long-end rates to continue to facilitate growth.
In a market where assets are highly correlated and acting like a light switch, long-only diversification can run into problems. It may feel great during the "on" phase but can be disastrous when the switch flips. Illiquidity induced selloffs usually take down all allocations. You don't want to celebrate "losing less"; you want the capital to step in when others can't. With markets remaining near all-time highs, the time to adjust is NOW.
TAIL LIQUIDITY
Most equity diversification allocations rely upon correlations to deliver value to portfolios. We built Tail Liquidity (CTL) to target consistent negatively correlated returns to equities to avoid relying upon correlation assumptions. To achieve this consistency, we rely upon a different lever than most, especially in the volatility space. Our return profile comes from an always-on convexity with respect to directional movement. When the market falls, the strategy has an increasing short market exposure. When markets rise, the strategy has a decreasing short market exposure.
Three Main Value Levers
Tail Liquidity is designed to be an unfunded portfolio construction tool which improves portfolios through three main value levers.
- Take more risk day one – Tail Liquidity is an unfunded, truly negatively correlated portfolio ballast allowing investors to increase equity & equity-like allocations.
- Redeploy capital during drawdowns – Tail Liquidity proceeds are unencumbered cash directly in client accounts allowing for immediate redeployment during market pullbacks.
- Improve tax efficiency – Tail Liquidity itself is tax efficient, accelerates the potential of tax-loss harvesting, and ensures the portfolio never ossifies.
Tail Liquidity has allowed portfolios to take more risk in equities, reduce drawdowns in comparison to a 60/40 portfolio, and improve the tax efficiency of your portfolio. Even though the past year has been difficult for the strategy, once taking into account tax benefits and intra-period rebalancing, portfolios have experienced less volatility and significantly lower drawdowns.
Q2 2026 Commentary
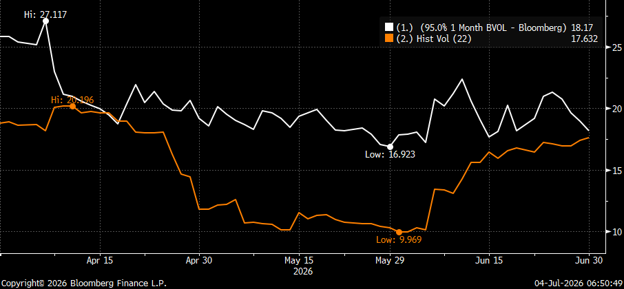
Q2 2026 was an incredibly powerful risk-on quarter. S&P500 was up ~15% and started the quarter with 9 consecutive positive weeks. This was the 4th longest positive run for the index in its history. Part of the move was driven by easing geopolitical tensions, although those tensions remained a meaningful headline risk throughout the quarter. With the potential for flare-ups at the back of markets minds, implied volatility remained marginally elevated, averaging ~20 for 1-month SPX slightly out-of-the-money put volatility (the long convexity fulcrum in the strategy) and in a range of 17 to 27. This volatility was ultimately similar to Q1 2026, these same SPX options traded between 14 to 31 with an average of ~20 even though Q2 had dramatically better returns. Ever since the start of tariff induced issues late Q1 2025, SPX volatility has been consistently elevated to actual market experience. The administration’s willingness to “upset the apple cart” all while equity returns remain fantastic is likely causing investors to both remain fully invested in risk assets BUT constantly looking to hedge the left tail.
Source: Bloomberg
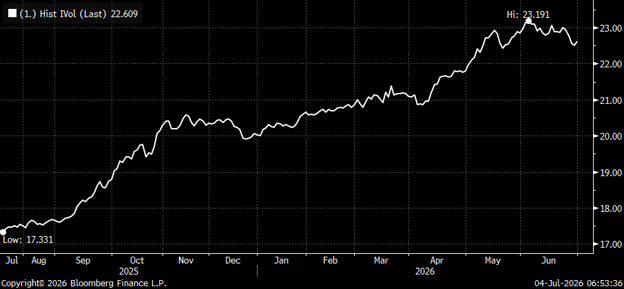
The other meaningful driver of returns in the quarter outside the easing of geopolitical risks was technology, specifically in the semiconductor sector. Technology produced almost 100% of the gains in the S&P500 even though it was the best quarter since the Covid era recovery. Putting some numbers to this to stress the concentration of returns: the State Street Technology Sector ETF XLK was up ~43% in Q2 and iShares Semiconductor ETF SOXX was up ~95% in Q2. Semiconductors are now the largest sub-sector in the S&P500 and technology represents all top10 holdings in the S&P500. Concentration has been a major theme in the last decade, but this has been the most dramatic quarter yet in terms of concentration of returns. Volatility is extremely elevated in these high performers with an example of semiconductors ending the quarter ~99th percentile volatility over the past 5-years. These dominate names are a major reason why SPX volatility remains elevated outside of geopolitical tensions.
*Source: Bloomberg
Outside of the implied volatility remaining elevated from geopolitical tensions and technology names, longer-dated volatility continued to expand throughout the quarter. This move in SPX LEAPS creates drag in the strategy. In our opinion, there is currently nothing more attractive in the SPX volatility surface than selling longer-dated out-of-the-money (OTM) puts. Volatility is extremely elevated AND skew (puts IV greater than calls IV) is very steep. Insurance companies buy these longer-dated OTM puts for regulatory purposes. Insurance investment products continue to grow which are on balance sheet liabilities for these firms. We believe the source of our core edge is expanding from the same known players. It has been a painful drag over the last year, but it is hopefully increasing the long-term value for the strategy.
The ability to rebalance and acquire more assets has allowed clients to continue improving returns through the accumulation of additional assets during draws and accelerated tax loss harvesting, while long-only diversification continued to provide very little diversification:
- We believe relying on correlations is a major cause of wealth destruction and is why we built Tail Liquidity. You don’t have to rely upon basis to bonds, or even equity implied volatility.
- Tail Liquidity’s goal in isolation is to capture 50% of the downside in markets in exchange for giving up 20% of the upside. Additionally, with separate account implementation, the strategy is collateralized by existing assets without disturbing the tax basis of those assets.
- Unencumbered cash liquidity provided by Tail Liquidity during drawdowns allows for opportunistic reinvestment and/or serving distributions without selling assets.
- Negatively correlated overlay increases portfolio dispersion and reinvestment increases tax lots, accelerating tax-loss harvesting potential.
CES - Absolute return strategy
CONCENTRATED CORRELATION HARVESTER (CES)
Concentrated Correlation Harvester (CES) is an absolute return strategy that sources edge from structural inefficiencies and forced trading activity rooted in concentrated stock risk management. Traditional concentrated stock solutions such as variable pre-paid forwards (VPPF), collars, and covered calls ALL result in the same activities: buying puts / selling calls. CES extracts value from these price insensitive options flows.
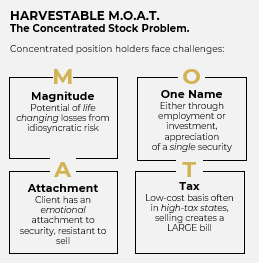
In response, concentrated positions holders turn to predictable strategies, dislocating options prices creating a harvestable opportunity. Due to the number of clients chasing this same solution, they are on the wrong side of the MOAT.
How has CES performed in different market environments?
CES has over four years of live track record and returns have performed in line with stated goals. During these four years we have experienced very different market environments to stress the resiliency of the strategy.
- 2022 was a down year where the strategy outperformed due to active rebalancing.
- 2023 was a highly correlated rally where the core edge delivered significant outperformance.
- 2024 had a significant dispersion in returns during a significant rally, challenging the core edge in strategy.
- 2025 significant drawdown with a high correlated V-shaped recovery, where the core edge delivered outperformance.
- 2026 has thus far been a year of extremely elevated implied volatility in the single names which has expanded our core edge during a choppy but rallying market.
*Source: Convexitas Calculations
The strategy closed near all-time highs and had its best outperformance month of the year during the choppy June.
As the demand for concentrated stock management intensifies, generally so does the edge embedded in CES. Additionally, we believe the growth in semiconductor related ETFs is creating an additional buyer of extreme downside in the sector. Consider using CES to transform industry wide concentration risk into durable edge and an opportunity for portfolio outperformance in your absolute return allocations.
Q2 2026 Commentary
A key to long-term growth of capital is compounding. CES set the table in Q1 for the massive benefits of compounding to take hold in Q2. During the first quarter of 2026, CES experienced strong performance throughout the quarter while the rest of the market faltered. CES is built to take advantage of structural mispricing in options and enjoy market chop, due to its positive asymmetry profile. Not only did the strategy achieve preservation of capital during a weak quarter for risk assets but accomplished solid growth of capital in Q1. This allowed investors to experience a fantastic recovery in Q2 from a much higher starting capital base.
During Q2, global risk assets achieved some of their best returns since the Covid era recovery lead by technology and specifically the “picks and shovels” of AI infrastructure buildout. S&P500 started the quarter with 9 consecutive up weeks delivering a ~20% rally over that period. Highly correlated / dramatic movement tends to produce strong results for the strategy due to the asymmetry profile. During April/May, the constituents of the sector generally moved in lockstep and higher as it was an indiscriminate risk on environment. CES exposure expands more quickly than benchmark in these environments, benefiting from additional risk taking during a rally. We continuously rebalanced risk to benchmark along the path, but swift correlated moves higher allowed the strategy to capture outperformance along the way. April/May is an “easy” environment for the strategy to simply enjoy its positive asymmetry homebase. Then we went back to chop in June.
June looked a lot like Q1, where there was solid movement with limited returns. Our core edge of elevated over theoretical fair volatility allowing the strategy to earn positive carry during the chop all while active management rebalanced risk to target. The strategy was able to achieve meaningful outperformance during this choppy month which compounded from the already strong capital base. We believe our edge has never been greater in the strategy as the products which create forced trading, most solutions for concentrated positions, only continue to grow. CES can achieve significant positive asymmetry while maintaining a positive carry position due to these volatility levels. We continue to monitor the supply/demand imbalances created from this concentrated stock solutions activity and look to continue to use this edge to deliver long-term growth through compounding.
FIRM UPDATES
MEDIA APPEARANCES
Convexitas rings opening cboe bell
On May 27th, Cboe invited Convexitas to ring the opening bell in partnership over our joint efforts to support Advisors and Wealth with meaningful options solutions and education.
Zed's daughter did the honors and we overheard from the crowd "she did better than a lot of adults!'
Prog G Markets: NVDA Earnings: Listen Here
NVDA Earnings - Beat / Raise / 80B Buybacks / Dividend increase to 25c. Market was pricing in a ~5.5% move, and actual movement on results was ~1.8%. Why so boring? NVDA has become a much less cyclical company making any individual earnings release less important. An analogy is that of AAPL over the last 15-years transforming from cyclical hardware to Annual Reoccurring Revenues of platform / services.
Schwab Network - The Watch List Panel: Memory Supercycle? Listen Here
Hyper-Cyclical – Memory: Memory is heavily commoditized which means supply/demand dynamics in the short-term matter most. Now, memory has historically extreme pricing power and that is why margins have been exploding higher. When highly cyclical companies are doing well, the market prices a cliff. Things are fantastic now BUT when the music stops, earnings fall off a cliff. If the cliff gets extended, even just for a year, this causes a dramatic change in fair value as an additional year of “peak earnings” gets banked.
Schwab Network Market On Close: Volatility Ahead of FOMC Listen Here
- Since the conflict began, WTI and 10y treasury yields have been tied at the hip.
- That is until the recent improvement in relations. Oil has moved from ~105 to ~75 over the last month and 10y treasuries remain somewhat stuck.
- Higher nominal growth / higher inflation means higher yields out the curve.
follow us for timely commentary
Follow Convexitas on LinkedIn to see these in real time, along with useful bite-sized clips from of our favorite parts of these interviews, like below!
ARE YOU USING OPTIONS WELL?
Thanks!
To our current clients - Convexitas is proud to support your practice and remains dedicated to providing the tools and investment edge that help you deliver an exceptional experience for your clients in 2026 and beyond.
To our prospective clients - We look forward to continuing our dialogue and helping you solve your most important problems. We are ready to work hard to earn your trust and provide you and your clients with durable investment edge.
We invite you to share the unique opportunities and hurdles facing your practice so we can help you deliver exceptional results!
Sincerely,
Zed, Devin, and Brian
want to talk?
Please leave your info for us to reach out or you can schedule a meeting now!
Let us contact you...
Ready tO Get Started?
Contact Convextias today to learn how you can increase your liquidity, react faster to opportunities, and confidently meet your financial commitments.
Introductory Information. This document (i) was prepared by Convexitas LLC (“Convexitas”) for the exclusive use of the intended recipient (the “Recipient”); (ii) is confidential and may not be distributed (except to your financial, tax or legal advisers) or copied without Convexitas’ permission, and must be returned or destroyed upon Convexitas’ request; (iv) is not an advertisement, is for informational purposes only, does not purport to be full or complete and may not be relied upon; (v) does not constitute an offer to sell, or solicitation of an offer to buy, any securities or investment services, including in any investment vehicle, account or other product (each, a “Product”) implementing Convexitas’ strategy (the “Strategy”). An offer to buy an interest in a Product may only be made by and is subject to the applicable investment management agreement, or other offering or subscription documentation (collectively, “Governing Documents”) and only in jurisdictions in which such an offer would be lawful. Any decision to invest with Convexitas should be made only after conducting such inquiries and investigations as the Recipient deems necessary, and consulting with the Recipient’s financial, tax and legal advisers in order to make an independent determination of the suitability, risks and merits of making an investment. No regulatory or self-regulatory authority has passed upon or endorsed this presentation, the merits of the Strategy or an investment with Convexitas.
Risk of Loss. Convexitas’ investment products, like all investments, involve the risk of loss. Investment products may be speculative and are designed only for sophisticated investors who are able to sustain the loss of their investment. Accordingly, such investment products are not suitable for all investors. The products sponsored and managed by Convexitas are not subject to the same or similar regulatory requirements as mutual funds or other more regulated collective investment vehicles. An investment in the Strategy is subject to complete loss.
Forward-Looking Statements. Certain information contained in this presentation constitutes “forward-looking statements,” which can be identified by the use of forward-looking terminology such as “may,” “will,” “should,” “expect,” “anticipate,” “project,” “estimate,” “intend,” “target,” “continue,” or “believe” or the negatives thereof or other variations thereon or other comparable terminology. Due to various risks and uncertainties, including those described in this presentations, actual operations, implementation or performance of the Strategy, or other relevant events, may differ materially from those reflected or contemplated in such forward-looking statements. No representation or warranty is made as to the Strategy’s future performance.
Hypothetical Performance: Hypothetical performance results have many inherent limitations, some of which are described below. No representation is being made that any account will or is likely to achieve profits or losses similar to those shown. In fact, there are frequently sharp differences between hypothetical performance results and the actual results subsequently achieved by any particular trading program. One of the limitations of hypothetical performance results is that they are generally prepared with the benefit of hindsight. In addition, hypothetical trading does not involve financial risk, and no hypothetical trading record can completely account for the impact of financial risk in actual trading. For example, the ability to withstand losses or adhere to a particular trading program in spite of trading losses are material points which can also adversely affect actual trading results. There are numerous other factors related to the markets in general or to the implementation of any specific trading program which cannot be fully accounted for in the preparation of hypothetical performance results and all of which can adversely affect actual trading results.
Past performance is not necessarily indicative of future results.